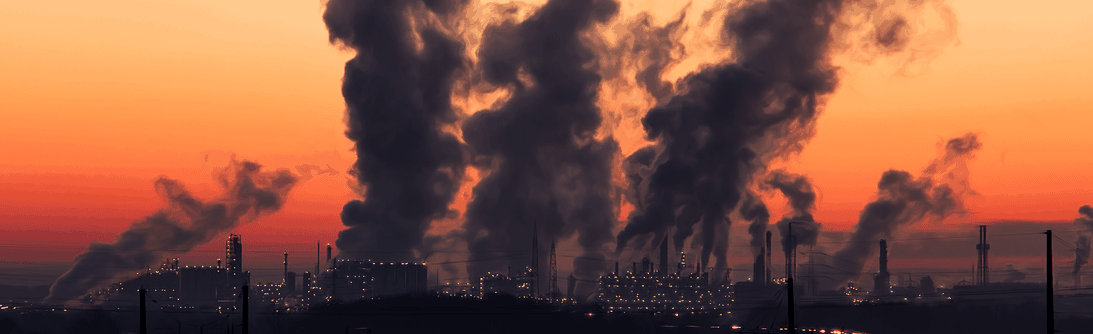

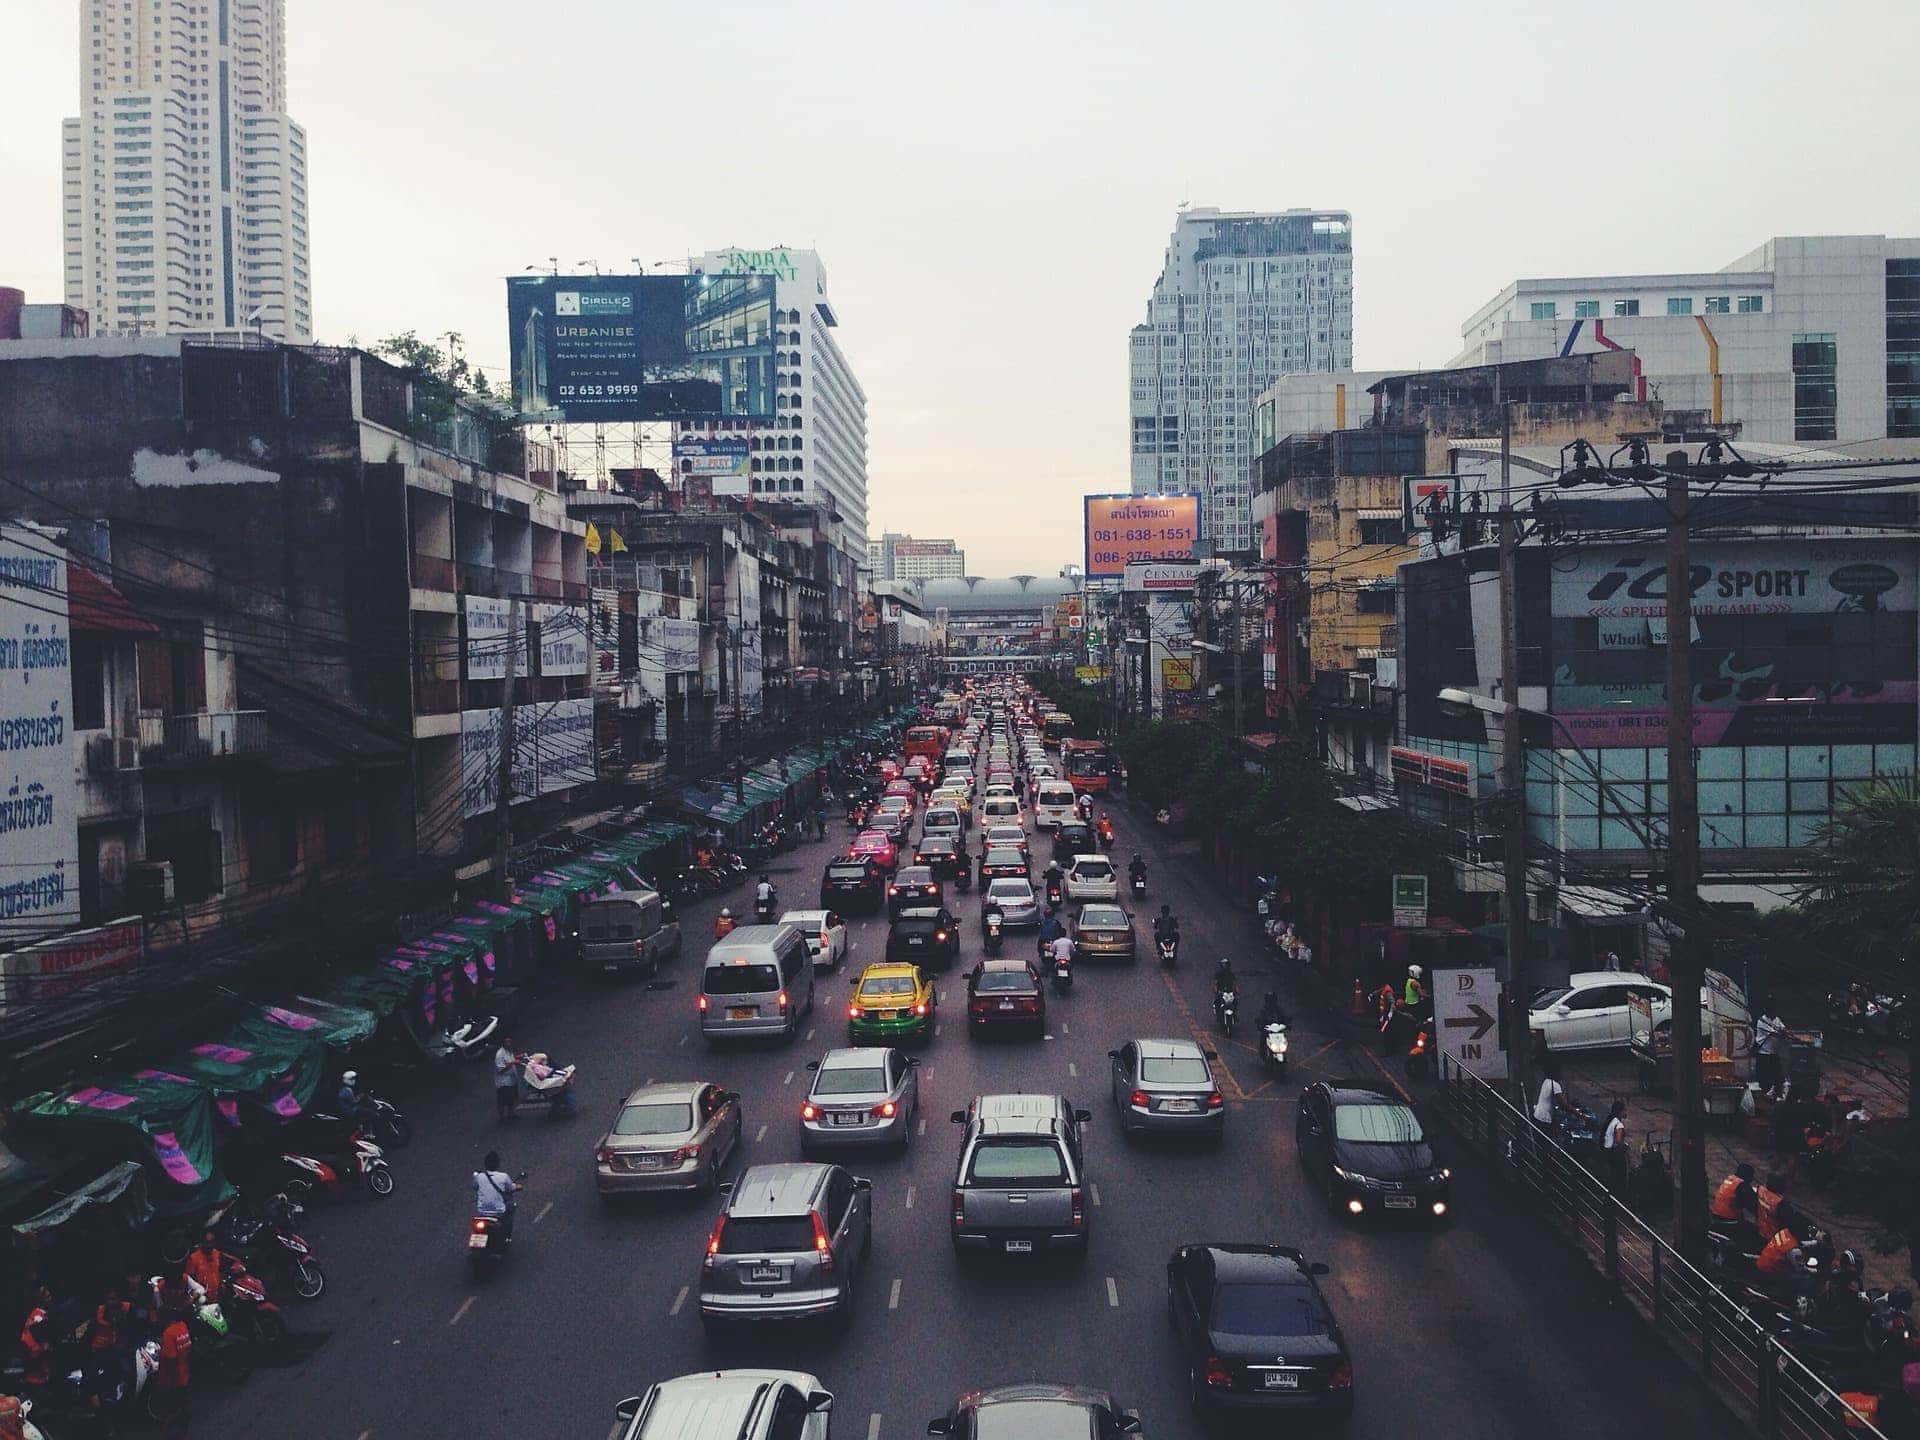
Air pollution is one of the causes of health problems in the population, and is also the cause of death in a number of city dwellers. Over 80% of people living in urban areas that monitor air pollution are exposed to air quality levels that exceed WHO limits.
Moreover, the World Health Organisation (WHO) warns that despite the fact that all regions in the world are affected by pollution, the population of cities with highest income levels are the most affected.
A problem that is growing
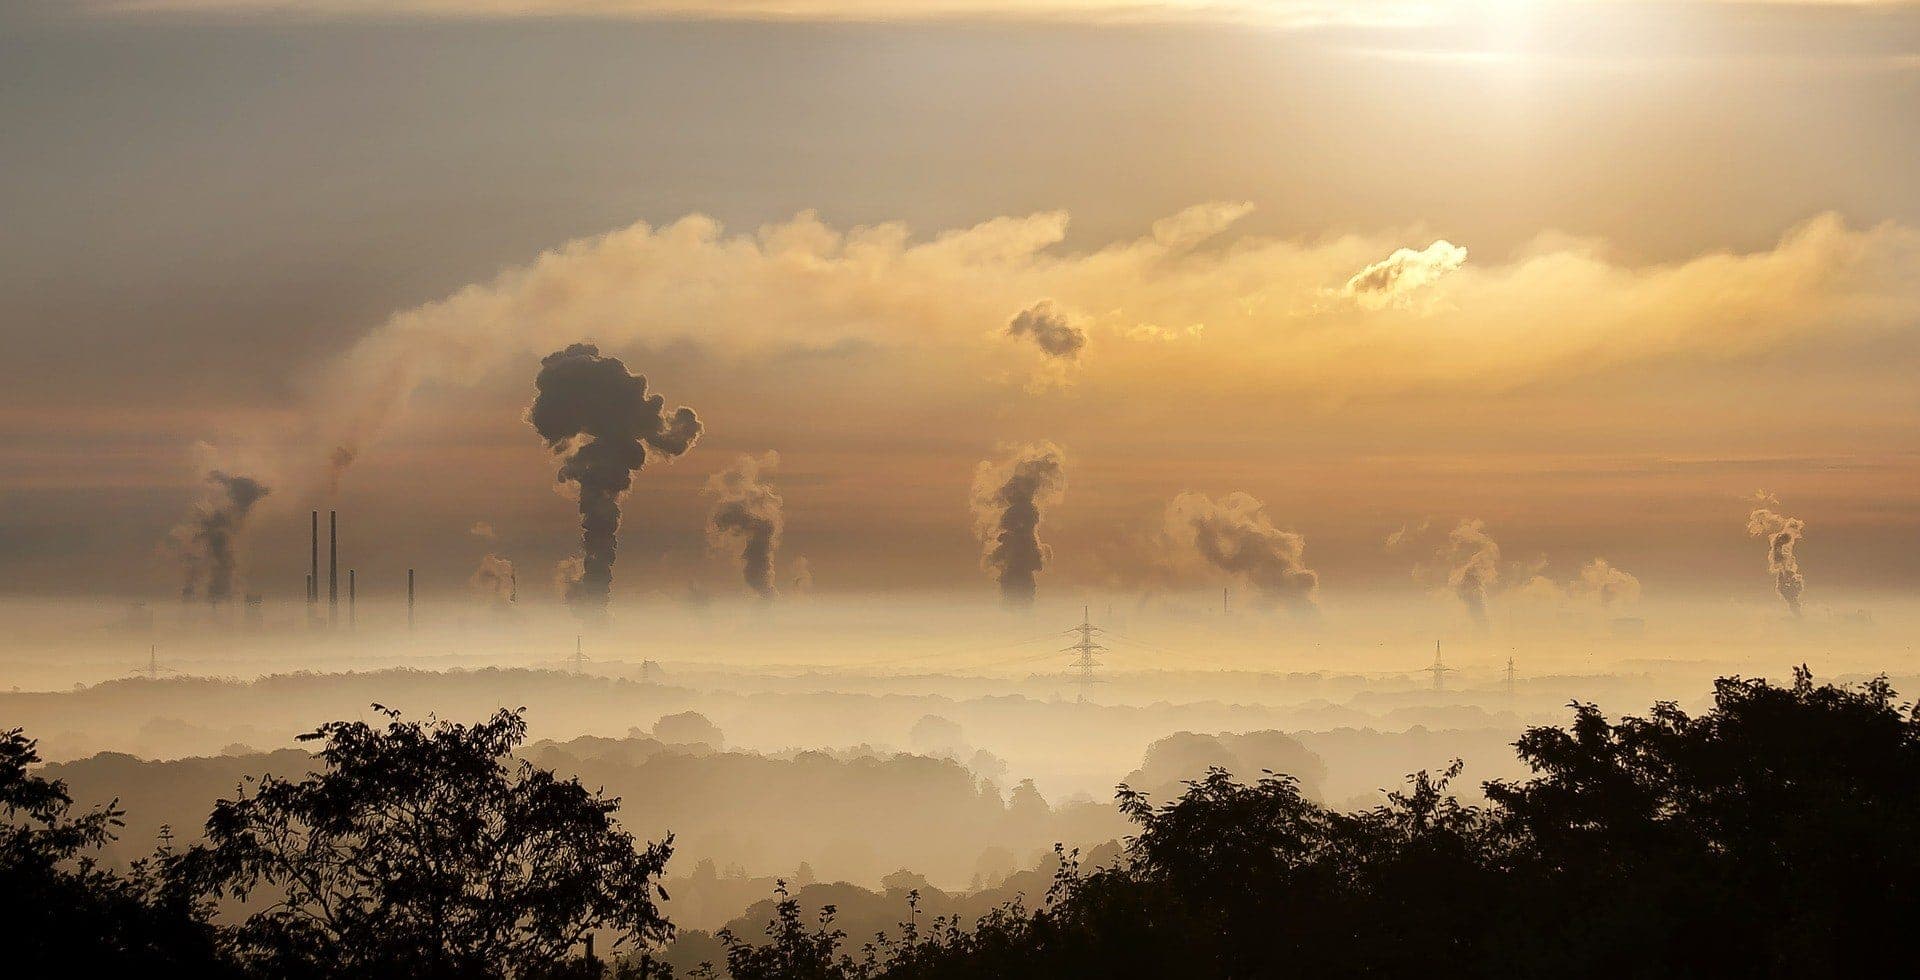
Additionally, according to OECD estimates, by 2050 outdoor air pollution will be the main cause of environment-related deaths worldwide.
This report also estimates that the number of premature deaths from exposure to harmful particulate matter worldwide will increase to 3.6 million in 2050, mostly in China and India. The absolute number of premature deaths linked to ground level ozone in 2050 is also likely to be the highest ever recorded, particularly in those two countries.
According to the World Health Organisation, in 2015 ambient particulate matter (not including tobacco smoke) was the sixth most harmful disease risk factor.
The pollution map
Aware of this problem, many governments (both local and national or supranational) are striving to adopt measures to limit its effects. This obviously requires, first of all, that the real scale of the problem is understood before solutions are proposed, and so increasingly all manner of data regarding air quality is measured and collected.
Information which is increasingly shared between institutions, enabling air quality maps to be prepared in real time for any part of the world. One of such initiatives is AirVisual, which shows pollution and wind direction in real time.
Waqi shows air quality with a Real-time Air Quality Index, as well as more in-depth information for each location on the map and a forecast for the coming days.
Big Data, Open Data
As we have seen, it is increasingly common for the relevant authorities to collect and share all this information openly, so that maps of this kind can be prepared and projects designed for pollution control.
A good example of this is Madrid. Here, the Town Council has several datasets on pollution (air and noise). All of these are available via the Town Council’s open data portal. There is also a web portal on pollution with data and reports in real time, in addition to open data files, available in different formats.
Additionally, Merche Negro, Head of Communications for the Environment and Mobility in Madrid’s local government, states that “[the local government] values positively (and very highly) civil society initiatives using any of the datasets provided by the Town Council to create additional or improved applications for the population”.
To support this, the Town Council promotes the organisation of hackathons – events lasting several days and bringing together programming experts to tackle a specific issue – and events on the use of Big Data to create applications aimed at mitigating the problems caused by pollution.
Other institutions also organise hackathons to promote not only the benefits and the potential of open data throughout the world, but also the use of meteorological, atmospheric and climate data.
Thus, at the Open Data Week in ECMWF from 28th February to 5th March 2017, the ECMWF (an independent intergovernmental organisation founded in 1975 and supported by 34 states which produces global weather forecasts), together with Copernicus Monitoring atmospheric composition and climate services, will enable all this Big Data to be used to build and test prototypes of new products and services.
Big Data for big and small
Analysis of Big Data on air pollution is not a business exclusively for large companies. Some start-ups have seen their chance in the analysis of air quality. The Israeli company BreezoMeter is one of those analysing freely available air quality data. Using such data, it developed a technology for providing quality data at street level.
In addition to other sources, it uses the free and open data provided by the Copernicus, atmosphere monitoring service, a complex combination of systems which collect data from multiple sources, such as earth observation satellites and in situ sensors such as land stations and aerial and maritime sensors. Such data is processed to provide users with reliable and updated information through a series of services linked to environmental and safety issues.
The BreezoMeter application, available for Android and iOS, is one of the first data platforms providing street air quality information in real time. It uses air quality maps based on geolocation and provides data within an approximate radius of 500 metres, in real time.
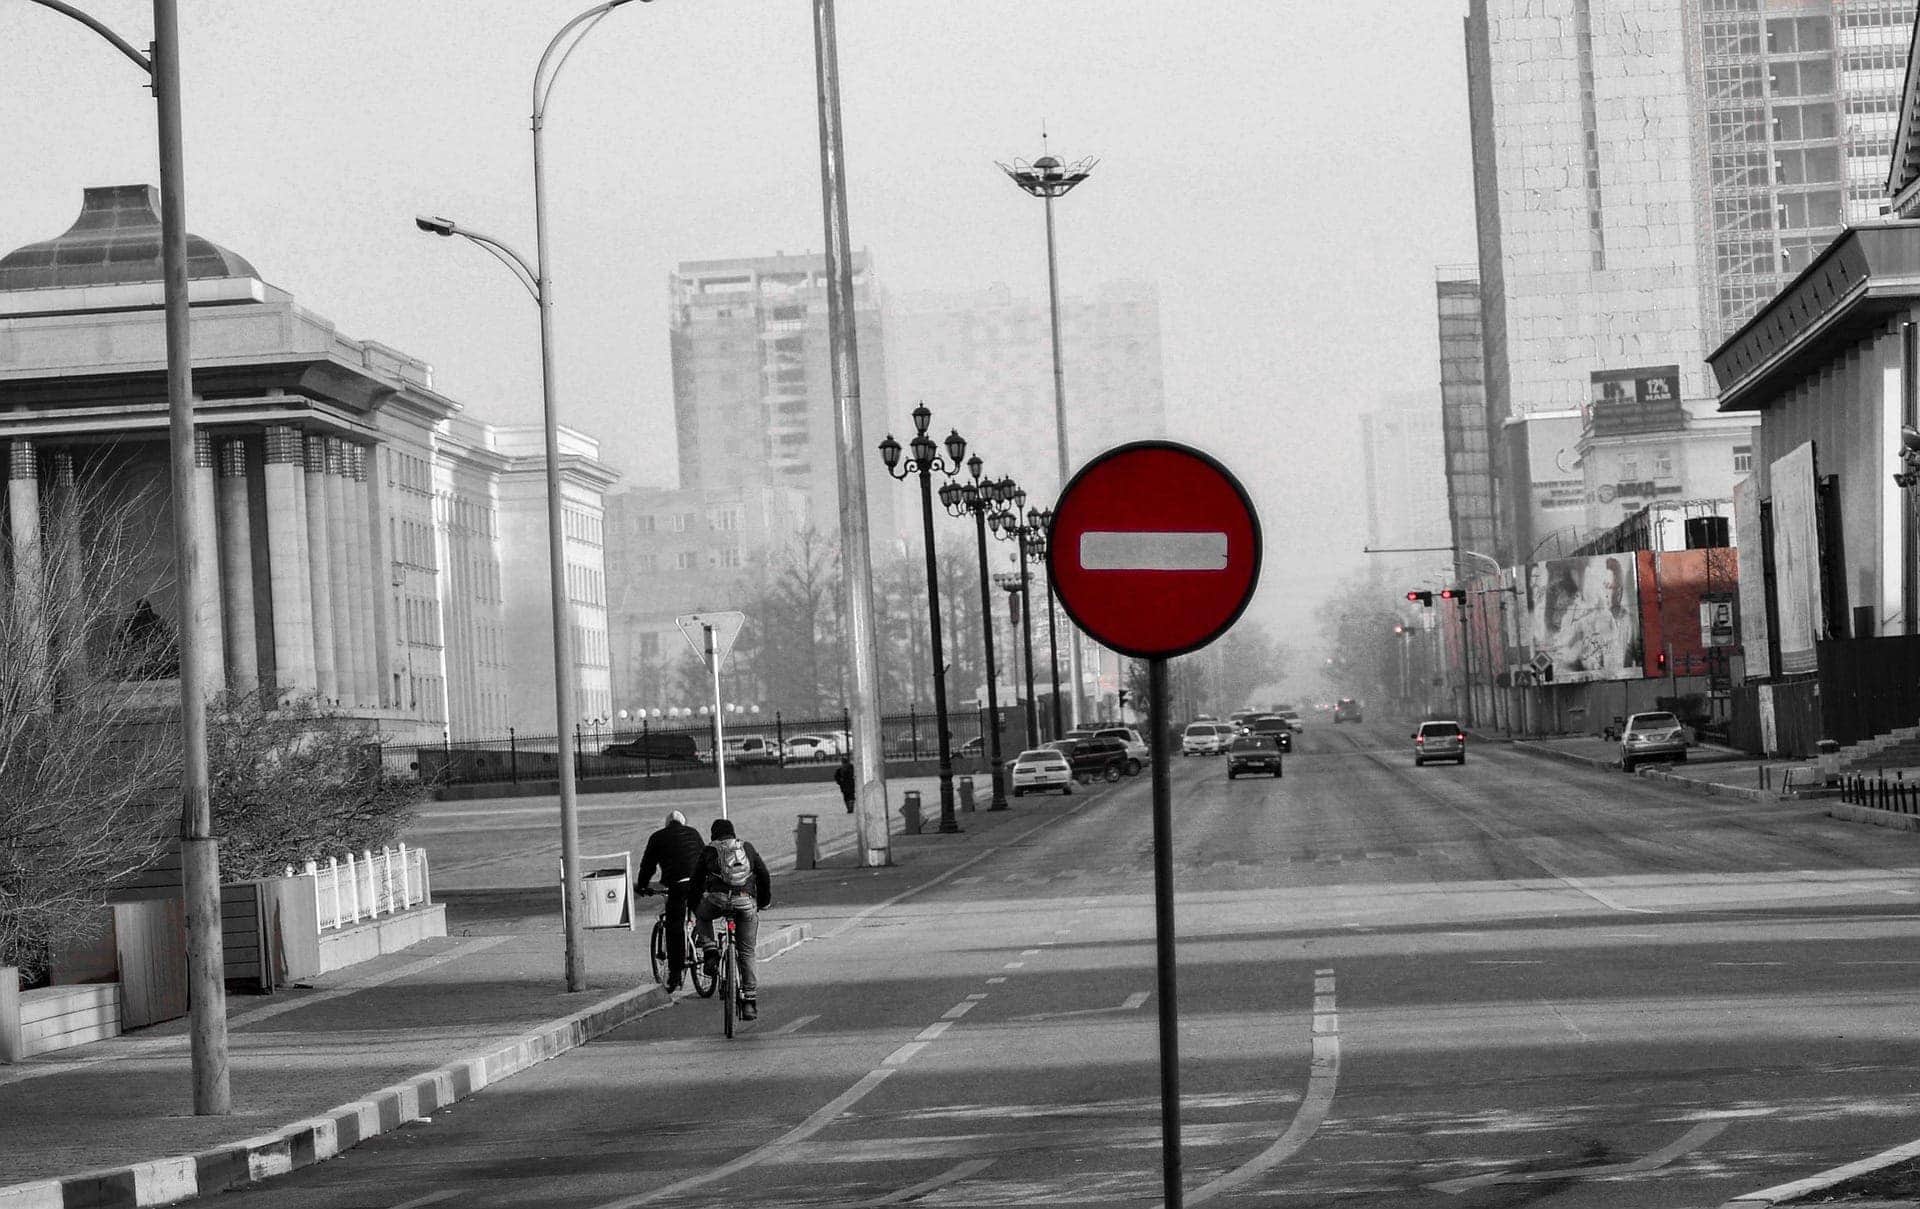
Not everything depends on Big Data
Analysing and understanding this huge amount of data can offer a better perspective of why air pollution happens and what could be the most efficient and effective measures to counter it. But responsibility will continue to be down to us, at both a personal and a collective level.
Although Big Data will never replace environmental responsibility, it can provide the tools and the vision we require to increase pollution control and improve our air quality.
Moreover, it allows us to make more efficient use of alternative energy, knowing when peaks of consumption happen and how to treat them in order to use our energy more efficiently. This will not happen overnight, but these options have the potential to improve the health of both humans and the environment.


There are no comments yet