One night like any other, your watch wakes you up. It is three in the morning, but your smartwatch does not show the time. Instead, the medical program shows a hospital call, which you pick up on your mobile phone. A doctor is talking on the other end: “Take two aspirins and wait for the ambulance.” “What ambulance?“, you think to yourself while processing what you heard on the phone and you go in search of aspirin.
You barely have the chance to take them when you hear a knock on the door and an ambulance takes you directly to the hospital. “He’s about to have a heart attack,” the doctor confirms after reading all the data that your watch has been taking while you slept, “but it has been successfully avoided. Rest here for the rest of the night and tomorrow you may go home. ”
Cities that are flows made up of data
If right now we do not see this type of medical operation it is not because the technology that supports it does not exist. Heart rate meters embedded in watches and connected to the Internet of Things via our mobile phone, televisions or processors in the cloud that detect cardiac abnormalities, are viable technologies today.
Although we would all be more relaxed if our loved ones had 24×7 medical care, the IoT will take time to penetrate the cities and arrive in crucial settings of our lives. Currently, the Internet of connected objects is used in a handful of smart cities applications to, among other great projects, reduce our environmental footprint.
A city, says the cellular urbanism of Ignacio Arnaiz, is a living organism with inflows and outflows. Very easy to see – always sets the same example – with thousands of vehicles that enter and leave a city using roads. However, there are many more examples, such as the daily travel beats that citizens make when they go to work or the incessant pumping of water and electricity through the supply networks.
If we can reduce the impact of these flows, we will be minimizing our ecological footprint at the city level. Cities are already a very efficient energy organism (due to grouping of localized services), but we know that by redirecting these flows wisely we will be contributing to more circular systems and, therefore, become more environmentally friendly. However, as in the case of the medical example, we first need to take measurements.
The example from the 19th century
Can you imagine that a pedestrian could ask for a turn to cross at a traffic light just by pressing a button and without the need for applications or smartphones? Instead, an intuitive interface that does not require installation or training of any kind works to ask for a turn.
Although it has been written in a modern way, the technology for “PRESS PEDESTRIAN” and “WAIT FOR PEDESTRIAN” marked a before and after in the management of traffic in complex crossings. The traffic signage adapted to the flow of pedestrians and this to the permissions that the traffic lights would grant (in turn replaced by the request to cross).
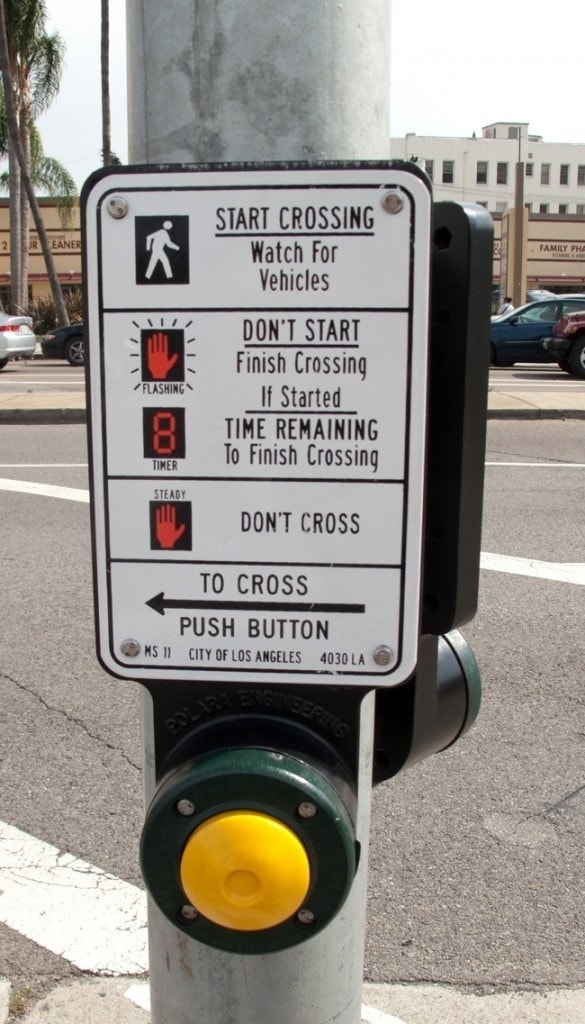 We use these transport examples because they are easier to visualize as pulsed information flows (for example, at peak times), or relate them to optimization that results in city-level savings.
Measuring and managing public transport
In an equally mundane example, perhaps even boring, is someone who leaves his house on his way to work and enters the subway. When swiping their transport card through the turnstile, the system detects a +1 at 7:36:56 08/04/2017. When, thirty-two minutes later, they swipe their transport card through the turnstile again, the system adds a -1 at 8:09:08.
+1 at 7:36:56 08/04/2017
-1 at 7:37:50 08/04/2017
+1 at 07:37:58 08/04/2017
+1 at 07:38:15 08/04/2017
-1 at 07:39:16 08/04/2017
…
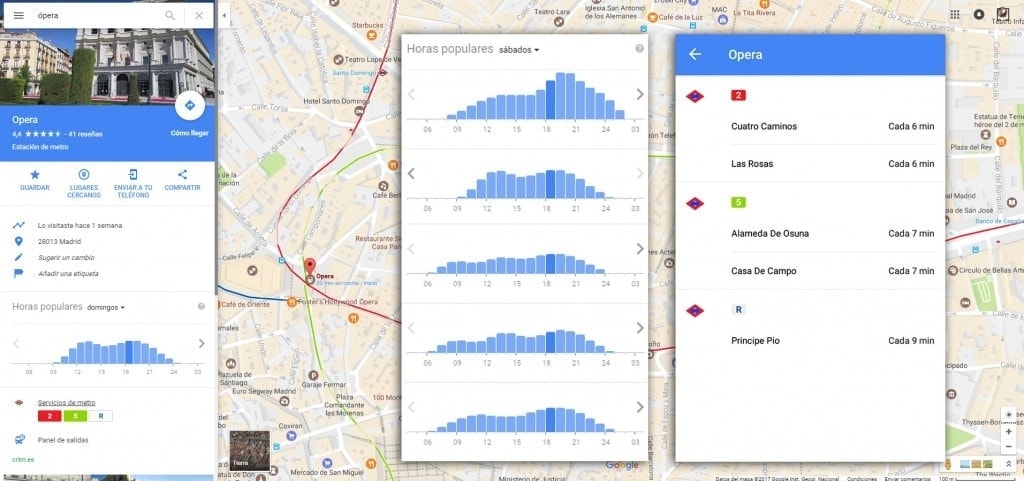
For the average reader, a grouping of data like these may mean rather little. However, a computer sees a pattern in millions of similar data with which it can do wonders. For example, to manage a minimum transport fleet to provide a quality service to the citizens of a city or generate updated reports minute by minute reporting to citizens regarding the updated transport status:
Thanks to millions of anonymous records like this we are able, as citizens, to check the best time to go to not only a metro stop but also to a restaurant, car park or cinema knowing the best way to reach the destination and knowing in advance the frequency of trains that there will be. Frequency using these same historical data to provide the number of minimum required trains.
We emphasize the concept of anonymised records, which is how the data in the above schemes are viewed, due to their importance. In order to protect people’s privacy, it is necessary that the information, although accessible, be recorded and displayed without names, or that there is no way to identify certain citizens with the recorded activities.
Since years ago this type of records did not exist, train cars went through the tunnels without regard to whether they would be too full, or if there would be many people waiting for them. As a result, not only did citizens receive lower quality public transport, it was also much more expensive for the city.
Already in 2001, the Norwegian band Röyksopp based a video clip on the key idea of the smart city: measurements to be able to manage. In the city in the video, various flows inside a city (person, water, food, and even transport and electricity) would give different metrics while dancing on the screen:
Education, culture and leisure, sport
However, cities are not just flows of people and transportation of materials (which is the simple part of smart cities). Managing the tangible is crucial for reducing environmental impact, but management of the intangible (education, culture, leisure, sport etc.) is necessary for the well-being of citizens.
That is why there is an entire Internet of Things slope of the smart city dedicated to continuous improvement of the tertiary sector as citizens find the information they are looking for. It is logical; if the citizens generate data; these are used to satisfy their needs.
That is why various countries and governments are creating their open data platforms (ours is data.gob.es) so that citizens have access to their data and can be used by public administrations and start-ups to increase the quality of life of people.
Facing the medical and transport examples, in the cultural field we can find such generic procedures as ” Procedures related to education” or as specific as ” Half Day Degree Formative Cycles. Students enrolled by branch of studies and course in which they are enrolled by municipalities in Aragon ».
Since access to this type of data depends on the administrations (and their level of knowledge in databases), many issues remain for municipalities and public services to turn over their data. These, once analysed by anyone who wishes, will give rise to knowledge about the city and citizen knowledge.
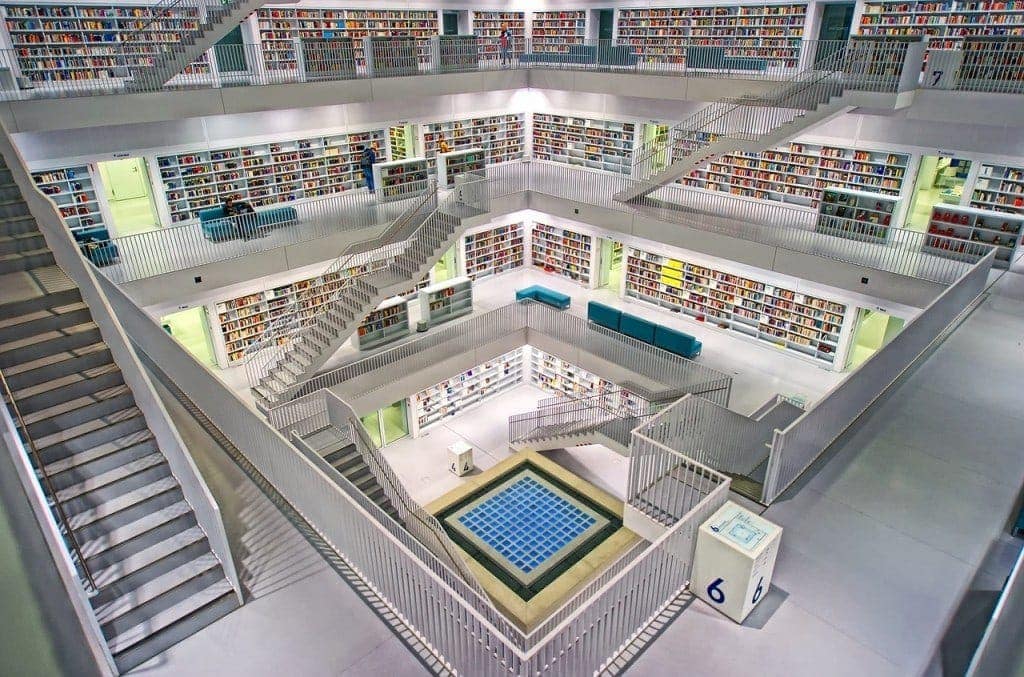
However, there are very complete databases at the national level, such as all public libraries in Spain or all sports facilities that provide service, from the creation of applications in the different software markets.
Every time a citizen takes public transport, borrows a book from a library, goes to a gym using their card or walks around the streets of his city, he is generating huge amounts of data that are recorded using different sensors that are sent to anonymous databases. These, in turn, are linked with the city’s service databases to improve the living conditions of citizens.
The Internet of Things, which will link to about 8.4 billion devices by the end of 2017, will exceed 30 billion in 2020 . By that time, we will be capable of wonders of detecting microleaks of water in pipes, opening the pavement only where necessary; we will be able to turn on streetlights only when there are vehicles or people in the vicinity, preventing senseless electrical consumption; and maybe event prevent medical ailments.
Photos | IStock / blackdovfx , iStock/jacoblund , AntionePound , Marcos Martínez , Stuttgart Library




There are no comments yet